Stocks notched a winning week as economic data continued to shine in spite of a last minute halt to debt ceiling negotiations. Despite still elevated prices and high borrowing costs, consumers were back to spending once again. April retail sales posted their first positive month-to-month print since January, led by discretionary spending for both goods and services. Meanwhile, the housing market appears to be showing signs of a rebound as we enter the typically busy summer homebuying season. Markets were initially poised to move higher during Friday’s session as congressional leaders looked to be inching closer to a deal to raise the U.S. debt ceiling and avoid default ahead of a June 1 deadline. However, stocks gave up earlier gains as GOP negotiators halted debt ceiling talks as spending cuts remained a major sticking point to a deal. The S&P still managed to finish higher on the week, up 1.65% on a potential consumer spending revival.
Consumers Back to Spending
After a Q1 hiatus, consumers were back to opening their wallets in April. Retail sales rose 0.40% in April – the first positive reading since January. That’s a strong rebound from March’s -0.70% decline. The headline figure was even stronger when you consider it was constrained by a -0.80% decline in gasoline receipts, bringing much-needed price relief to inflation weary consumers. The control group, which excludes autos, gas stations, building materials and supply stores, and tobacco stores rose a strong 0.70%, above analyst estimates of 0.40%. Miscellaneous store retailers led the gains, rising 2.40%. Online sales followed, up 1.20%, while health and personal care retailers notched a 0.90% increase. Food and drinking establishments also proved popular, up 0.60%. Year-over-year, sales were up a robust 9.40%. The foundation seems to be set for a summer consumer spending revival supported by healthy income growth, softening inflationary pressures, excess savings, and ongoing revenge spending.
Housing Market Primed for One Hot Summer
Consumer confidence is running high, prompting homebuyers to make their way back to the housing market despite high prices and borrowing costs. That bodes well for homebuilders who have seen strong demand due to existing home supply remaining tight. Single-family housing starts rose 1.60% to an annualized rate of 846K in April. Meanwhile, building permits rose 3.10% to a seasonally adjusted annual rate of 855K, a 7-month high. April also marked the third straight monthly increase in single-family building permits. Permits rose in all four regions, signaling strong nationwide demand. As homebuilders shined, existing home sales struggled, falling -3.40% month-over-month to a seasonally adjusted annualized pace of 4.28 million units. Year-over-year, sales were down -23.2%. Inventory remains tight with 1.04 million homes for sale at the end of April. This is only an increase of 1.00% compared with April of last year when rates were much lower. At the current sales pace, that represents a 2.9-month supply. By comparison, six to seven months is considered a healthy balance between supply and demand. However, pockets of strength are beginning to emerge in the existing home sales market. The median price of an existing home sold in April was $388K, down -1.70% from the previous April. The drop was driven by a decline in sales at the higher end of the market, above $500K as affordability remained a sticking point. However, homebuying activity between $350K and $400K appeared to be regaining traction with multiple offers returning in the spring buying season. High activity toward the lower end of the segment is welcome, and a strong indication consumers seem confident in the economic outlook to make a big ticket purchase.
Final Thoughts
While many economists are still predicting a shallow recession and there are numerous data points suggesting the economy is continuing to moderate, the overall economic outlook still remains better than expected. Strong wage growth combined with easing inflationary pressures have lifted consumer confidence in recent months. This week’s retail sales and housing reports provide more evidence the economy is gathering momentum as we move into the second half of the year. The Atlanta Fed’s GDP Now model is currently forecasting Q2 GDP growth of 2.90%, up from Q1’s 1.10% pace. Housing is expected to play a strong component of that growth rate with residential investment growth expected to rise 0.60%, up from a previous forecast of -6.30%. The latest economic numbers fly in the face of Wall Street’s consensus for a weakening economy and the need for a Fed pivot later this year. Bond markets, which have been a relatively good indicator for the health of the economy, are now reflecting a “higher for longer” consensus with the 10-year treasury yield rising to 3.70% today. The rise in yields coincides with comments from the hawkish Dallas Fed President Lorie Logan and St. Louis Fed President James Bullard, who both spoke out against a rate pause at the Fed’s next meeting. Absent a collapse in the labor market that would hold consumer spending back, consumers for the time being seem ready to spend once again after a sluggish Q1. That would support recent ISM business surveys, which show businesses expect demand to pick up in the coming quarters. Unfortunately, that strong economic growth could once again reignite inflationary pressures and potentially lead to more Fed tightening later this year, throwing cold water on the year’s market rally.
The Week Ahead
The Memorial Day weekend marks the unofficial start of summer. With traders set to pack it in for a long weekend, Week in Review will take a pause from the action. Our next edition arrives on June 2nd with the latest nonfarm payrolls and manufacturing prints.
A Complicated Picture of the U.S. Consumer
Much like the debt ceiling debacle that is playing out in Washington, D.C., U.S. consumers are grappling with their own set of challenges. While the numbers above in our market commentary show spending levels that indicate a rebound in the health of the U.S. consumer, bear in mind it’s not always as clear cut as some of the data and headlines show. For every positive metric, one can also point to a negative metric.
A study released last month showed that more than half of Americans – 58% – are living paycheck to paycheck. The CNBC Your Money Financial Confidence Survey also revealed that a third of these households have incomes above $100,000. Similar data was reported in Fortune magazine, pointing to a separate study by PYMNTS.com and LendingClub released in April 2023 that showed that 60% of Americans are living paycheck to paycheck.
The conditions of the U.S. consumer and their spending habits paint a very complicated picture as demonstrated by the insights below:
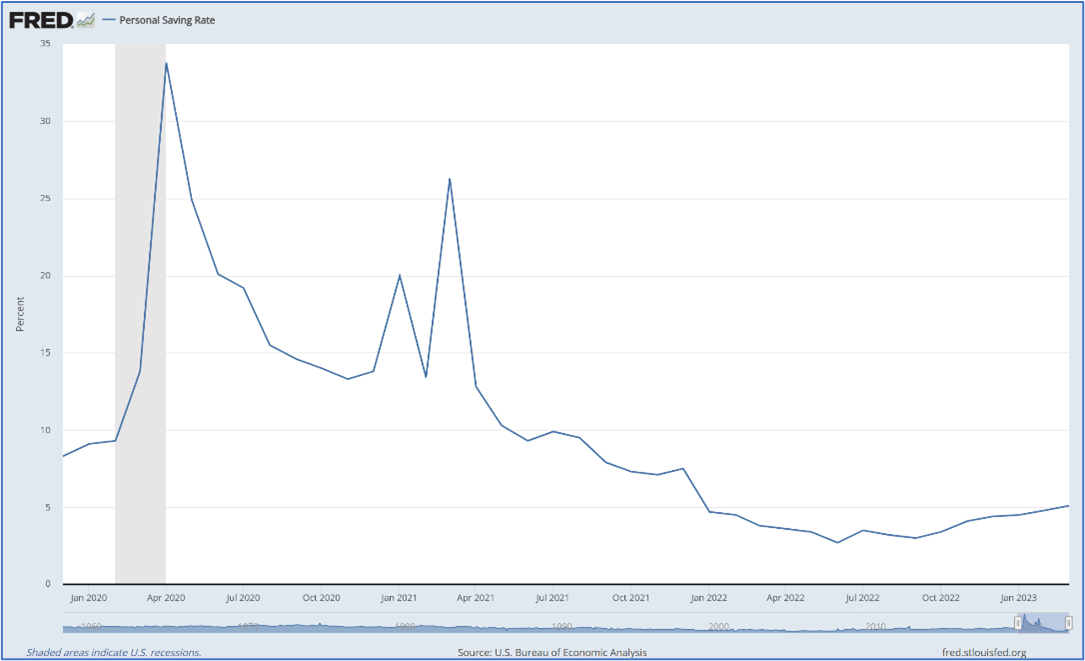
Personal savings rate: There were periods of the pandemic when households across the country were saving as much as 30% of their monthly income. Stimulus payments, unemployment benefits, and staying home meant consumers were able to stockpile some cash and even pay down debt. However, coming out of the pandemic, pent up demand unleashed a spending craze. Inflation also stressed consumers’ pocketbooks. As a result, the savings rate declined in 2022 to its lowest level since 2008. The chart below shows the U.S. Personal Savings Rate over the past five years. The savings rate in December 2019 was 8.3%, and it climbed to 33.8% in April 2020. By June 2022, it reached a low of 2.7% but has since climbed back up to 5.1% as of March 2023.
Shift in consumer spending: Consumers are trading spending on goods for spending on services. Spending is down at retailers such as Home Depot and Target, yet up elsewhere as mentioned above. Home Depot just announced its forecast for a decline in sales of up to 5% for the fiscal year, and Target expects sales to remain sluggish with a low-single-digit decrease in comparable sales for the year. On the flip side, airlines are forecasting a banner year with a massive rebound in travel. The upcoming Memorial Day holiday weekend is expected to be the busiest in terms of travel in nearly two decades. So while some retailers are signaling a softening, industries such as travel and tourism are poised for record seasons, and restaurants are also signaling a rebound with an anticipated 6.4% growth in sales to reach $997 billion this year.
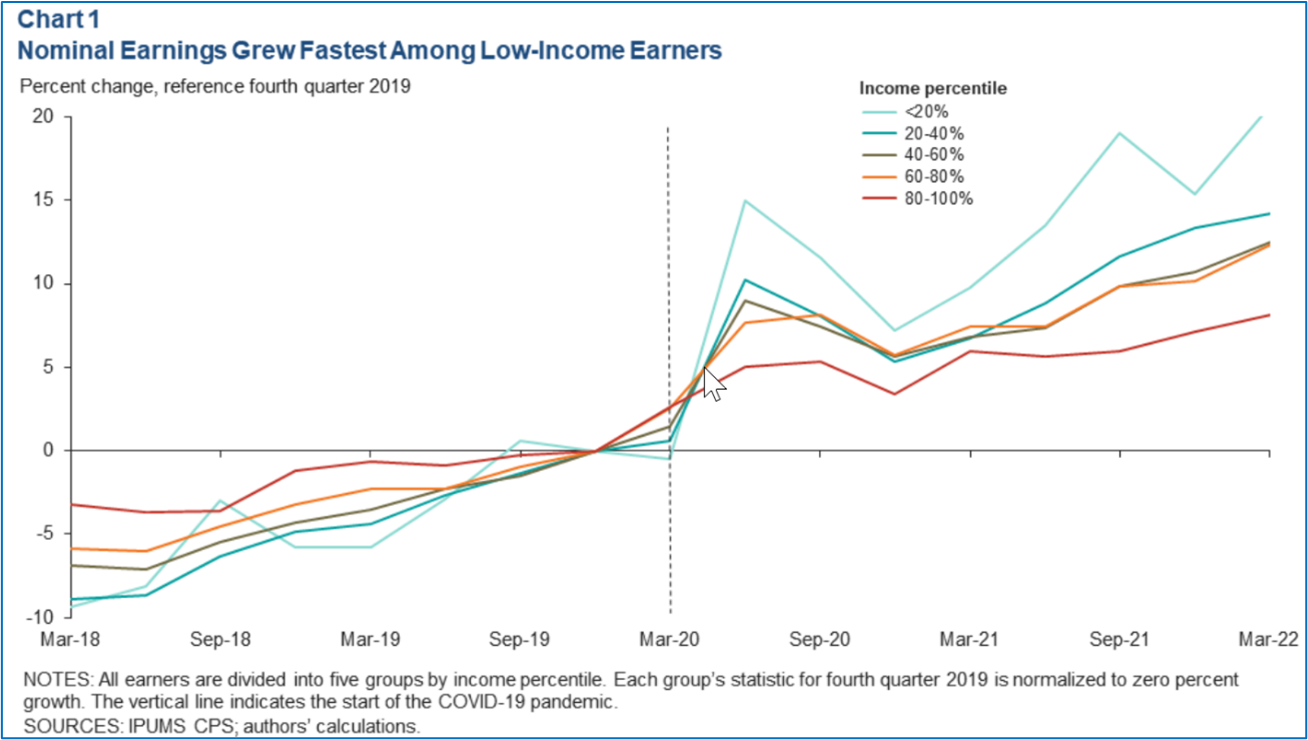
Uneven wage growth: Wage growth is keeping pace with inflation, but the largest gains in wage growth were among lower income workers as shown in the chart below. Low-income households spend a higher share of their income on basic needs which means the workers who saw the greatest wage increases are those with lower discretionary spending. Furthermore, as we have seen, individuals can use savings and borrowing to smooth consumption in response to economic conditions. These factors further complicate the picture of the U.S. consumer.
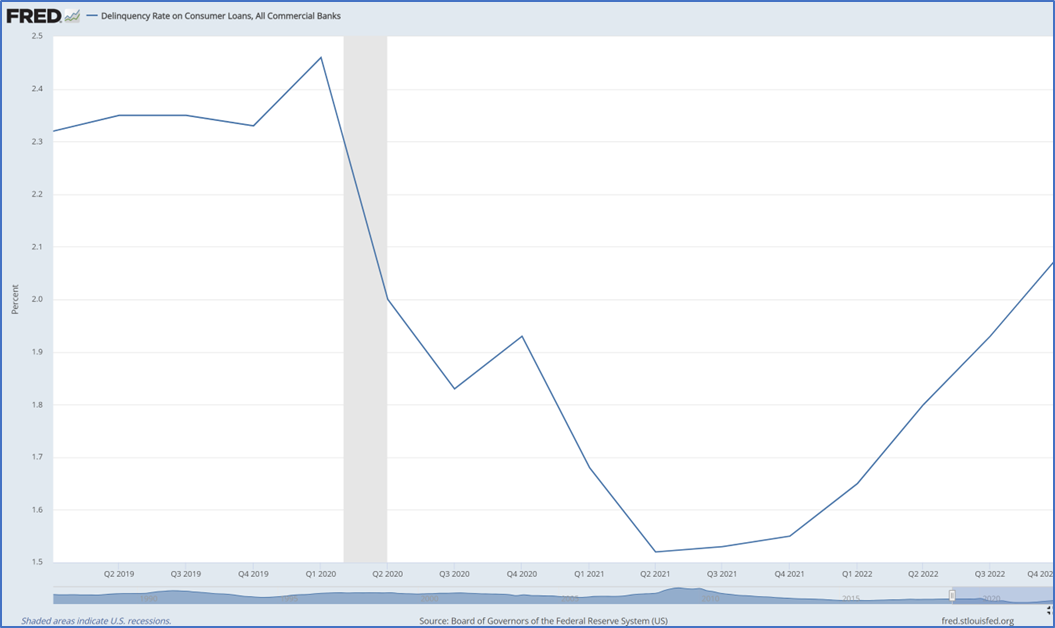
Rising default rates on credit card debt: Credit card balances typically decline in the first quarter of the year as consumers pay down debt from holiday-related spending. That did not happen in 2023. Total credit card debt remained steady, and the delinquency rate was up 3.04% from Q1 2022. About 4.57% of credit card debt transitioned to “serious delinquency” last quarter, meaning cardholders were more than 90 days past due. For perspective, the chart below shows quarterly delinquency rates on consumer loans which includes credit card debt, auto loans, and personal loans from 2019 to Q4 2022 (the most recent data available). The delinquency rate declined in 2021 and has been rising steadily since, but it is still lower than where it was pre-pandemic.
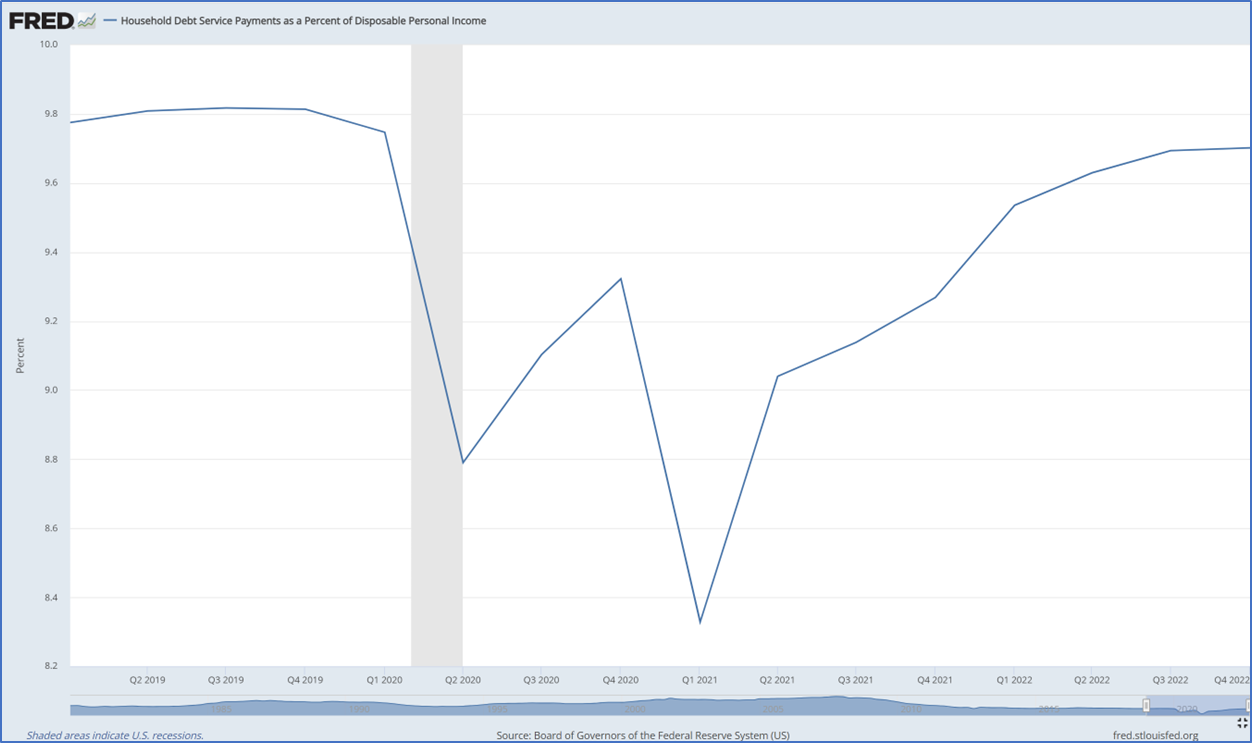
Spending supported by debt: Consumers are leveraging up to support their spending. Household debt balances set a new record high of $17.05 trillion during the first quarter of 2023, growing $148 billion or 0.9% from the fourth quarter of last year. That debt load has spiked by $2.9 trillion since the end of 2019. Debt as a percentage of income declined during the pandemic and has been rising since 2021, but the chart below shows that it is currently lower than pre-pandemic levels.
The economic conditions over the past few years have revealed a resilient consumer. The good news is that easing inflationary pressures, strong wage gains, and a healthy labor market support continued consumer spending. The Fed having at least given lip service to a pause in raising rates should give consumers the confidence to spend so long as rates hold steady. It is still a complicated picture of the U.S. consumer, but overall the data presents a fairly positive outlook.


