Fed Weighs Markets Versus Consumers

June 14, 2019
A crisis was averted for avocado fans this week as the U.S. and Mexico struck a last-minute deal on immigration to avoid tariffs on Mexican goods that were set to go into effect on June 10. The deal brought a sigh of relief to markets as U.S. companies, who have grown increasingly dependent on the region as a low cost supply source, will be able to keep their supply chains intact. In economic news, U.S. retail sales posted a healthy rise, while consumer and producer price inflation remained well contained. Overseas, China released its trade report showing its domestic economy continues to feel the strain of U.S. tariffs. The S&P 500 managed to post its second weekly gain, adding 0.47%.
Consumer Spending Rises
Despite trade tensions running notably higher on Wall Street over the past several weeks, Main Street didn’t seem bothered as consumers snatched up autos, appliances, and sporting goods in May. For the month, the Commerce Department reported retail sales rose 0.50% last month to $519 billion. That follows an upward revision to April retail sales which were revised higher to show a 0.30% gain instead of a previously reported -0.20% drop. Gains were broad-based in May with autos posting a 0.70% rise, electronics and appliance stores +1.10%, sporting goods and hobby stores +1.10%, and bars and restaurants +0.70%. Excluding autos, gasoline, building materials and food services, retail sales rose 0.50% in May, which follows an upwardly revised 0.40% increase in April. With consumer spending accounting for two-thirds of the U.S. economy, the back to back strong prints suggest the U.S. economy will maintain its economic momentum in the second quarter. The Atlanta Fed’s GDPNow tracker is currently estimating 2.10% GDP growth for Q2 2019, up from a previous estimate of 1.50%.
Prices Hold Steady
Consumer and producer prices held relatively steady in May as both rose 0.10% for the month. On a month-to-month basis, consumer price inflation actually slowed from April’s 0.30% gain as the increase in the cost of food was offset by cheaper gasoline. Core inflation, which excludes volatile food and energy prices, rose 0.10% for the fourth straight month. Year-over-year, consumer prices were up a modest 1.80%, slowing from April’s 1.90% rise. Core consumer prices were up 2.00% year-over-year in May, down from April’s 2.10% rate. Producer prices also showed little signs of inflationary pressure in May as a decline in prices for gasoline, food, and a volatile category known as “trade services” kept broader inflation in check. On a year-over-year basis, producer price inflation remained soft just as we saw with the consumer, rising only 1.80%. That is down sharply from a peak of 3.40% reached last summer. Excluding food and energy, the index was up 2.3% from the year earlier period. Tame consumer and producer inflation suggest the current round of tariffs have had little impact on the overall price level, which is good news for the consumer while putting the Fed in a very interesting situation as it contemplates a potential rate cut.
China Struggles with U.S. Tariffs
China’s trade report painted a weak outlook for their domestic demand as imports fell -8.50% in May from a year earlier. Meanwhile, exports rose 1.10% year-over-year, but the rise was chalked up to businesses rushing out orders to beat the deadline for higher tariffs on Chinese goods which went into effect earlier this month. The much-followed trade surplus with the U.S., one of the major sticking points in the on-going negotiations with the U.S., widened in May to $26.9 billion from $21 billion in April. This week’s trade report is the latest in a string of weak reports for the Chinese economy, raising the question as to how long the Chinese economy can withstand U.S. tariffs when overall global growth continues to be muted.
Despite China’s weak trade report, markets remained in a rather optimistic mood as the U.S. managed to strike a deal with Mexico last week to avoid tariffs, retail sales showed healthy consumer spending and probably most importantly, the market has begun to anticipate a rate cut from the Fed. It has been a deceptively bullish market on a month-to-date basis, rising 5.20% through today’s market close. There have been flashes of volatility but as of late, investors have scooped up stocks in anticipation of a Fed rate cut. Markets appear to have already priced in a cut with the S&P 500 now trading a mere -2.00% below its all-time closing high. Going into the week, it appeared far more likely than not that the Fed would be nudged off the sidelines to cut rates, but today’s retail sales report showed the consumer – the bedrock of the economy – still remains strong. With the Fed having recently signaled an openness to reducing rates, it will be interesting to see if they opt to stick with fundamentals or whether they will placate markets next Wednesday with a rate cut.
The Week Ahead
Traders will be glued to their screens as they await signs of an interest rate cut at the Fed’s FOMC Meeting. We’ll also have the latest on the real estate market with reports on existing home sales and housing starts.
The World’s Most Valuable Brands
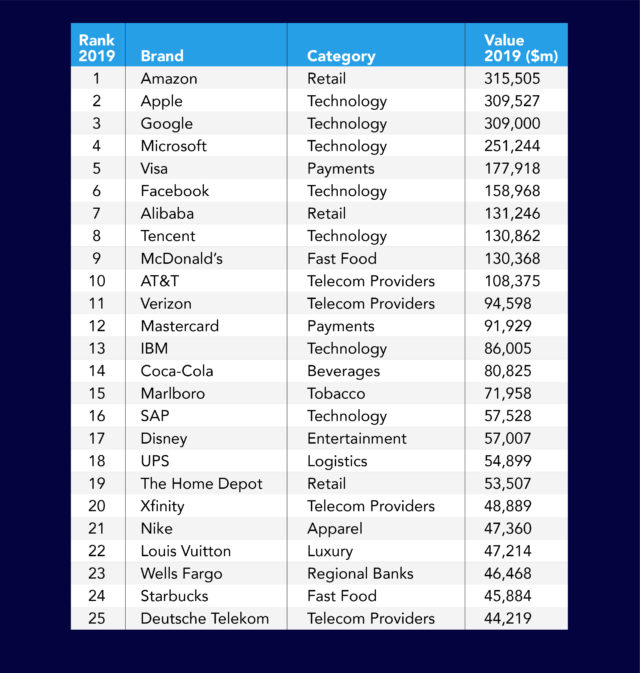
Amazon just overtook Google and Apple to become the world’s most valuable brand with a brand valuation of $315.5 billion according to a ranking released this week by research agency Kantar and commissioned by WPP. Apple came in second in the brand ranking at $309.5 billion followed closely by Google in third at $309.0 billion. Apple and Google had previously had a 12-year hold on the top two brand spots.
In 2018, Amazon’s share of the U.S. e-commerce market hit 49% which is 5% of all retail spent across the entire country. Roughly 95 million people pay for Amazon’s Prime subscription which is now $119 per year. The company’s diversification and expansion into new revenue streams and its positive customer service reputation, not to mention its same-day delivery option as well as one-day and two-day shipping, have enabled it to grow its brand value a whopping 52% year-over-year. The company started out as an online bookstore in 1994 and now competes in all areas of e-commerce, as well as cloud computing, digital streaming, and artificial intelligence. In 2015, Amazon launched Prime Day, its biggest, global shopping event exclusively for Prime members. Last year’s event set a sales record with consumers purchasing more than 100 million products. Analysts estimated sales topped $4 billion. Sales surpassed Cyber Monday, Black Friday, and 2017’s Prime Day (which, itself, improved upon the 2016 event by 60%). The official date for Prime Day in 2019 hasn’t been announced, but since 2015, Amazon has held its Prime Day sale in July.
Technology companies have led the Top 100 Brand ranking ever since Kantar’s first global brand value ranking in 2006, when Microsoft took the top spot. The brand valuation methodology used by Kantar involves a survey of more than three million consumers worldwide and encompasses more than 100,000 different brands in over 50 markets. The researchers uncover each brand’s ability to appeal to customers and validates that data against sales performance, company financial data, current performance and anticipated future earnings, and many other metrics to isolate the dollar amount a brand contributes to the overall value of a corporation.
Brand value is different than a company’s market capitalization which is calculated by multiplying the total number of shares by the present share price. Amazon has a market capitalization of $921 billion, Apple’s is $887 billion, and Google’s is $756 billion. Both Apple and Amazon reached a one trillion market capitalization during the 2018 fall peak, however, both dipped in the fourth quarter, and Amazon remains higher today.
The annual global brand ranking study showed that luxury is the fastest growing category (+29%) followed by retail (+25%). The research also showed that a new generation of brands — GenZ brands which are those created after 1996 — are growing almost four times more rapidly than brands created in the millennial era of 1977 to 1995. A total of 23 GenZ brands appear in the Top 100 with an average age of 16 years compared to 18 millennial brands averaging 33 years.
U.S. brands dominate the Top 100 Global Brands list, but many non-U.S. brands also appear. Below is the list of the top 25 brands. To see the full list of the Top 100, click here.

